I am going to investigate other quakes of this year, but it seems to me this force is trying to apart the lands between morth and south sides.This is the force that seperated morth and south america, this is the force that separated Africa and Europe to create mediterranian sea. Or this the force that created the closed Caspian Sea. This force is characterized by deep quakes that felts over large areas.
I do not have time but my brief investigation tells me that in late 2010, and this year, 2011 more quakes occurred below 2.5. The mass of the targeted area for the force was too big, that's why only small quakes occurred. Many of them occurred in deep sea, with no harm to human population.
I also counted floods, weird quakes felt by people with no harm.
Quakes are not abnormal, but this year

Figre 1a. Such force zones can be named fault zones of early history.


Figure 1c. striae gravidarum (stretch marks);
Pregnancy formed striae over skin by sudden stretch force over skin by the growth of baby in abdomen.


Figure 1e. A different example for forces(pink lines) drawed by myself and daily activity obtained from daily earthquake activity map. I used both topography and daily activity from 10/31/2011 map(a date close to 23/10/2011 7.2 magnitude Van Earthquake date)

Figure 1d. A different force example map

Figure 1e. A different force map. I drawed this pink-colored force line on the map minding the earthquake activity around Pacific Ocean Ring-Fire on 11/1/2011 after 23/10/2011 7.2 Magnitude Van earthquake. On 11/1/2011 no damaging magnitude quake occurred, there are still many activities all around any continents.

Figure 2. After some volcano eruptions and quakes i tried to follow the force, as shown by a pink line. Force line is not supposed to give the exact quake location, but it gives the target of the force.
Once the forces found then mineral rich chain mountain areas will be dropped from force affectable places. I have not investigated soil mineral distribution over places in this map yet. But, high chain mountains are the strong places to stay silent over centuries. I also sometimes look at maps showing the deepness of the seas, then I analyse each depth as a different group. It is not easy sometimes to say which place is high which place is low. To me it seems that the entire Africa continent is lower than Asia continent. I need to spend more time on height of continents and depth of seas to say more.
When I draw force lines i also consider nearby rivers, river beds are themselves early earthquake faults to me (length, width of river etc). Both sichuan-2008 and Van(23/10/2011 quake ) are near to long rivers, highest mountains and lakes.
A earthquake worker should definitely follow this map at: http://www.emsc-csem.org/Earthquake/Map/gmap.php
for a year specially following earthquakes, and alsoshould follow climate changes and Earthquake, temperature, flood correlations. Some floods and small quakes are secondary to the earthquakes or topography changes according to my interpretations(Think the stretching when a baby kick by two legs and 2 hands from inside towards out mother skin :) or just baby grows in mother abdomen, stretches skin ).
How cold would change earthquake forecast I also mind.

For example the China Location, with coordinates 43.77 N ; 82.46 E, as shown on the map(Figure 3. ), a place both has lake and mountain-with comparable temperatures topographies to New Zealand quake, Japan quake, Tailand(october-2011) flood**, Van quake -was on my feared forecast list after 23/10/2003 7.2 Magnitude Van Earthquake, it occurred as I forecasted but it did not cause any damage with a magnitude(6.1) (I also failed to predict exact month or day), probably the strong wide long mountains with a big mass resisted to the force luckily.
After The February 22, 2011 New Zealand earthquake (with a magnitude 6.3); I forecasted an earthquake, to occur within months, under 6 magnitude around Greek island of Karpathos offshores (using my complicated force drawings and topography similarities hypothesis), indeed as I approximately predicted, on February 28, 2011 an earthquake occurred at Karpathos, but it wishfully was a very small earthquake without any damage(around 5.9 magnitude).
Using my topography characteristics, the enormous mass of South America, climate temperature characteristics knowledge, and hypothetical force lines; I managed to predict an Earthquake sometime in 2011, around 5.7 magnitude, and to occur at night temperatures, at very west valley of South America, after Van 7.2 magnitude 23/10/2011 earthquake.
The 5.8 Antafagasta actual Earthquake occurred at around evening on 11/5/2011 Antofagasta, Chili fortunately with no damage at all.

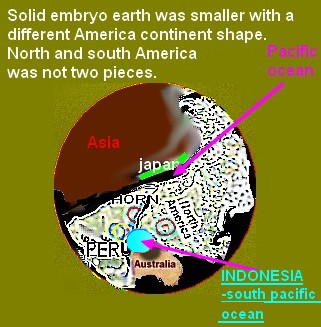
Figure 4. When I forecast Earthquake, floods I always create some imaginary possible maps on my mind. Above map is prior to pacific oceaon created by an explosion from pasific ocean crater. America and Asia was a whole land, then the pasific ocean crater exploded and two lands formed. Then the crater filled with water become the big pacific ocean. That there were only one land before 7 continents is a wellknown hypothesis I found on internet I agree. To this already known one-land Earth hypothesis that my contribution is which I assume the volume of Earth was smaller at very early historical times, then the volcano (today it corresponds to the pacific-ocean-crater) exploded and increased total volume of Earth in space. Another old crater is Antartika according to my approach
If I have time I may draw this imaginary map better. I created the map using map here.
Meanwhile I am about to draw somehow more complicated force lines over Earthquake-daily-activity-maps, but I need to spend more time to talk more about it. My some unusual force examples are at below(Figure 5a, Figure 5b )

Figure 5a

Figure 5b. The 3 Pink lines direction shows 3 different forces. When forces are not just simple straight lines but unusual as in Figures 5a, 5b, then to predict earthquakes becomes very hard for me.
 Figure 5c. A different example TO SHOW FORCES

Figure 5d. This is a map that I rotated and drawed many lines to connect some activities listed on
11-20-2011. I do not have time to talk about right now, but this is a way I look at maps, activity correlations also.

**Although floods sometimes kill more people than a 8.0 etc. magnitude earthquake, in my earthquake forecast approach, a flood is a smaller than an Earthquake breaking force. IT MEANS TO ME THAT my quake-feared list may rather have floods, but not big quakes. Predicting earthquakes may also help to predict floods. Sometimes I forecast an earthquake, but only floods occur. 
Figure 5d. This is a map that I rotated and drawed many lines to connect some activities listed on
11-20-2011. I do not have time to talk about right now, but this is a way I look at maps, activity correlations also.
fİGURE 6. ıF On the current Earth map I was asked to show the very early start of earth formation, which there was hardly solid soil, but mostly HOT gasES METALS. I would consider cross-pointed areas as the first relatively solid appearances. Was this mixture WAS ABOUT TO create mostly Africa soil ?, I need to investigate further. Then the gas-solid mixture growed and cooled and aparted from todays europe (crosspointed location ) towards Africa location. moved to create solid lands
I might need to spend more time to reach details on internet, but such mission extrawork probably would cost me 4 YEARS less life expectancy, anyway that I communicated with this blog to give my approach made me glad that if sometime someone thinks in this way, i am here who does this approach.
P.S.: *I learned maps rather three diomentional with lakes, mountains, rivers, with climates, day-night temperature differences with yearly rain distribution etc. I hardly know cities on the map, I also approximately definetely know how far a location is from ecvator and from pacific ocean. But, I like the coordinate language most to talk on blog to describe ocean quakes better.
P.S: I am in a cOUNTRY located in East Europe right know. Well, after Van 23/10/2011 Earthquake I was a little bit afraid that the city I am in right now(~1700 kilometers away from Van) could have an earthquake to afraid. nobody felt anything(or did not talk about it) but myself ,some thousands of small things I felt prior to 23/10/2011 Earthquake were tremors correlated with Van Earthquake. Their magnitude could never reach even 0.1 mAGNİTUDE, but they existed prior to Van eARTHQUAKE. These tremors are so tiny, it is hard to discriminate them from someone is working on my upper floor to repair house walls. but as of today, 11/2/2011, I am feeling good,
it seems to me that quakes are likely to occur at about south pacific ocean at places no human lives, offshores of continents. If an earthquakeoccur about mountains, I always check Australia, it isrich in metals to absorb specialwavelengt of sunlight; it is good that this year no big earthquakes occurred in Australia compared to its early times. It is also good that no big Earthquake activity or big floods occurring on Africa continent.
In future we need tools to record earthquake tremors below 1 SİGNİFİGANTLY.
P..S: Whenever I write the flow-chart of my thoughts, I notice that no language can be fast to catch the speed of thoughts, or images thought in the brain. If we human live 300 YEARS, THEN WE WİLL SPEAK a better language which would be very fast. But, today we live short, we do not have long time to wste time for a fast language for 15 YEARS. Images themselves could be the best language if we would develop a better image compatible language. Well, I do not have time to work on a better faster language. When we speak long words are better for correct understanding, but when writing even short words can be precise, we should make use of written communication. I am never a person who likes learning via listening. I like reading and seeing. Unfortunately, today's primitive education mostly is based on hearing from a teacher who speaks not more than a robot can.
I am a top 10 highest educated scientist of world; when I calculated all my hearing based education, it turned out that only 5% of knowledge was via hearing. Almost all my knowledge was based on either reading or seeing. When I communicate I use hearing and my voice most of the times, but as an educational tool hearing is wrong method.
Well hearing is wonderful when one listens to favorite music on her/his free times. When I study, work I do not like to listen to any music.
Below are two maps (Figure 7, and figure 8) with date 11/4/2011

Figure 7

Figure 8
I will take same location activity after 3, 6 and 9 months laters to show how activity changes by time after the 23/10/2011 Van 7.2 magnitude Earthquake.
fİGURE X. IMAGINARY gAS EMBRYO LAYERS FOR EARTH.
The first imaginary layer is seen from inside of Earth, not from the sky (see the detailed view of south America and Africa here. Think that there is an eye inside of magma, and views towards out.)
aT THİS TİME THE VOLUME OF EARTH WAS SMALLER THAN TODAY.

fıgure XX

THE QUESTION IS: wHİCH SEPARATED FİRST?
Africa from ASIA?
or South America from North America?
or occurred simultaneously when Earth was gas-solid embryo.
What was created first? Indian ocean or Mediterranian sea? I believe Indian ocean is older than mediterranian sea.